Sustainability Assessment · Resilience Indexing · GIS Dashboards · AI Policy Recommendations · Sdg Localisation
A peer-reviewed, field-validated ecosystem of digital governance platforms that transforms community-sourced and sensor data into evidence-based sustainability indices, GIS-mapped risk profiles and AI-generated stakeholder-specific policy recommendations. Grounded in 19+ years of Live-in-Labs® community engagement, four interlocking platforms — SREE, Mera Gaon Hamara Jal, the Carbon Neutrality Dashboard and the Amrita Multi-Hazard Dynamic Dashboard — reach 5,500+ households and 1M+ beneficiaries across 25 states, advancing SDGs 1, 3, 4, 6, 7, 8, 11, 13 and 17.
Uttarakhand · Himachal Pradesh · Haryana · Uttar Pradesh · Rajasthan · Gujarat · Bihar · Odisha · Madhya Pradesh · West Bengal · Karnataka · Kerala · Andhra Pradesh

SREE — AI Sustainability & Resilience Platform
GIS Hotspot Mapping & Risk Profiling
Amrita Multi-Hazard Dynamic Dashboard
Carbon Neutrality Dashboard
Mera Gaon Hamara Jal — Water Governance

AI Multi-Stakeholder Policy Recommendations

India’s first geo-enabled, AI-driven platform for micro-level community sustainability assessment across water, health, education, agriculture, livelihood, energy, waste and disaster domains. Computes thematic sub-indices and a composite Sustainability Index; classifies communities against SDG India Index 2023–24 benchmarks and delivers role-specific AI policy and intervention recommendations. 4,555 households · 10 states · Environmental & Sustainability Indicators, Elsevier 2025 · Indian Patent 202541040498.
Community-level carbon tracking platform monitoring methane avoidance (paddy AWD, biogas, livestock), soil carbon sequestration, clean-energy uptake and waste valorisation — computing a live Carbon Positivity Score per community. Generates MRV-aligned data for climate-risk finance instruments. Integrated with IoT sensor feeds from 14 CCRRC hubs across 13 states; linked to the Circularity Index.
SREE: All 10 communities classified Aspirant (<50 index score); Water scored highest (65.1, Front Runner). Bihar education analysis — literacy 40.3%, dropout 86.4% — triggered targeted NIPUN Bharat, NISHTHA & PM POSHAN recommendations. Water: Alappad identified as highest-risk water cluster (~37% threshold exceedance); open wells classified Unsuitable (median WQI 155.8). Multi-Hazard Dashboard: 25,000+ helpline calls and 100,000+ people connected to rescue coordination during Kerala Floods 2018; 3× IPL World Centre of Excellence designation; NABARD Rural Innovation Award 2012.
Geo-enabled participatory platform using 50 water sustainability indicators across social, economic, environmental and institutional dimensions. Computes Water Poverty Index (WPI) and Water Quality Index (WQI); generates threshold-based binary risk matrices, PCA-validated composite scores and spatial hotspot maps, routing stakeholder-specific recommendations across five governance levels — household to national. 1,039 households · 10 communities · Scientific Reports, Nature Portfolio 2026.
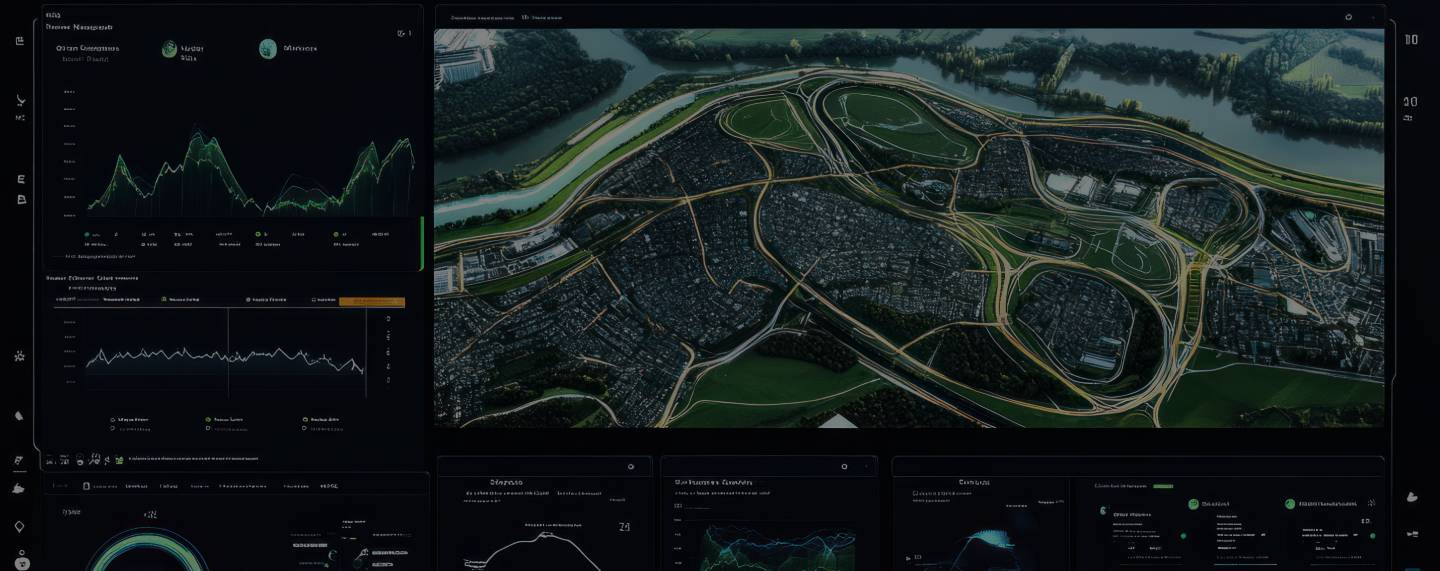
A real-time, GeoAI-powered dynamic dashboard unifying landslide, flood, tsunami, drought, heatwave and disease-outbreak risk streams into a single community-facing and administrator-facing interface. Integrates 300+ AI-IoT deep-earth sensors (to 33 m depth), AmritaKripa flood monitoring, OceanNet coastal observatories, hyperlocal weather stations, crowd-sourced Landslide Tracker reports and satellite remote-sensing layers. Delivers 3–24 hour advance multi-hazard warnings across 25 states; operational since 2009; 5,000+ lives protected. Collaborators: British Geological Survey, Durham University, National Research Council Italy, IOC-UNESCO.
Micro-level index aligned to SDG India Index
AI recommendations from ground data
19+ yrs · multi-hazard · 25 states
WPI · WQI · Carbon tracking
GIS · IoT · GeoAI · crowd-sourced
